


Oil and Natural Gas: Oil remains below resistance at $72.00
- This week’s oil price movement has been moving above the EMA50 moving average.
- The price of natural gas continues to retreat from the $2.70 level.
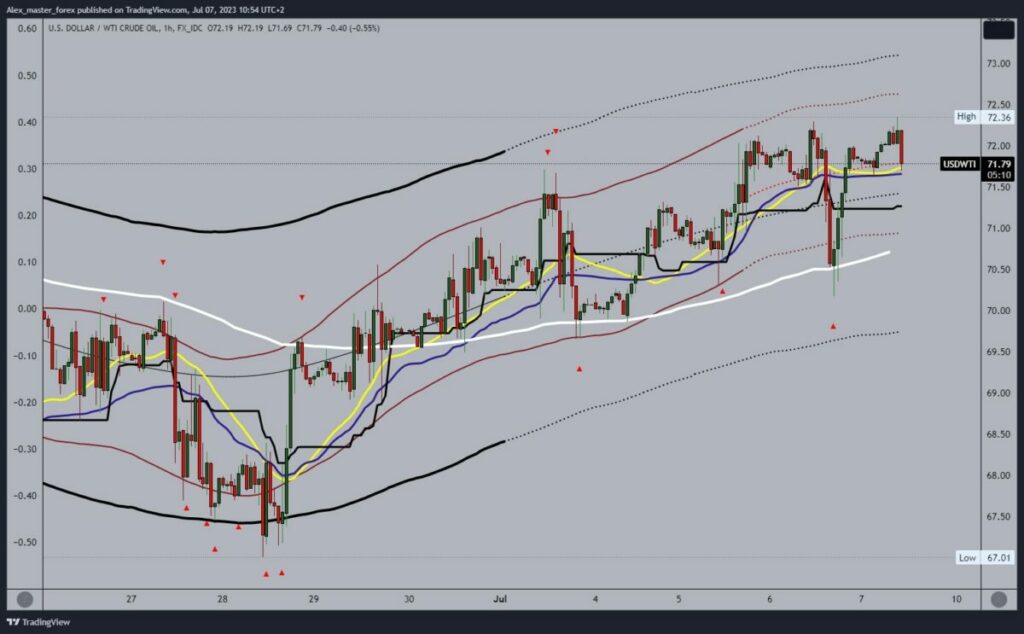
Oil chart analysis
This week’s oil price movement has been moving above the EMA50 moving average. On several occasions, the price made a pullback to the EMA50, found support on it, and then started a new recovery. On the upper side, we have resistance in the zone around the $72.00 level, which for now, does not allow the price to make a concrete breakthrough above it.
We need a positive consolidation and a break above the $72.00 level for a bullish option. Then we need to consolidate at that level before we start further recovery with a new impulse. Potential higher targets are the $72.50 and $73.00 levels.
We need a negative consolidation and pullback below the $71.50 level for a bearish option. After that, we could expect to see a further drop in oil prices. Potential lower targets are $71.00 and $70.50 levels.
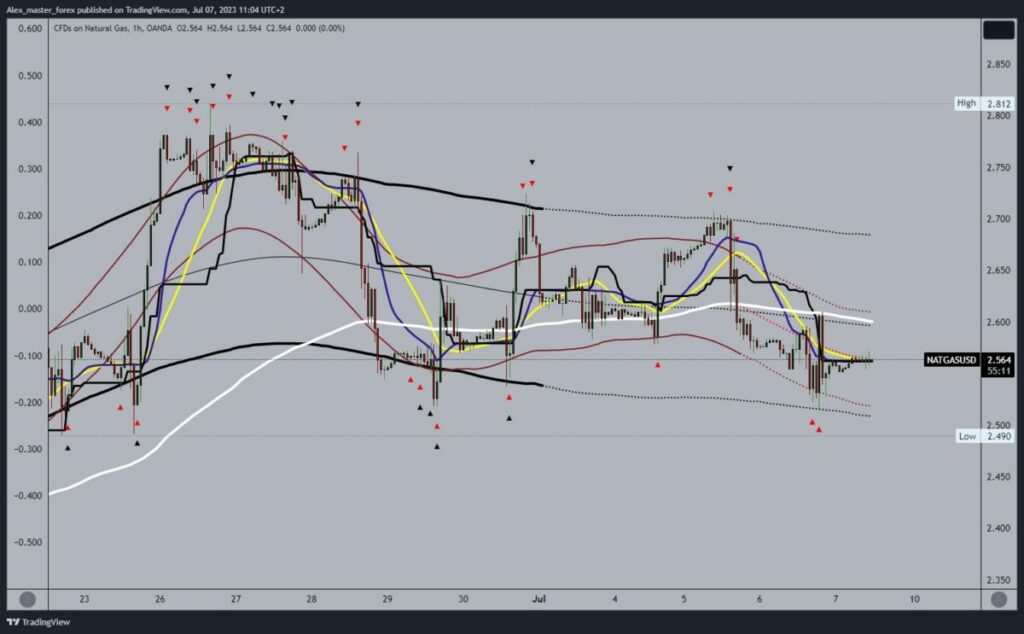
Natural gas chart analysis
The price of natural gas continues to retreat from the $2.70 level. Yesterday I formed this week’s low at the $2.52 level. After that, the price briefly recovered to the $2.60 level and made a new pullback. Additional resistance at $2.60 is the EMA50 moving average. The price is currently at the $2.55 level and moving sideways.
We need a continuation of the previous negative consolidation for a bearish option. That would bring us to a new test of support at the $2.50 level. A break below would form a new low and would mean that the price could soon slide lower again. Potential lower targets are the $2.45 and $2.40 levels.
We need a positive consolidation and a return above the EMA50 moving average and the $2.60 level for a bullish option. Then we need to hold ourselves up there before we begin further recovery. Potential higher targets are the $2.65 and $2.70 levels.
The post Oil and Natural Gas: Oil remains below resistance at $72.00 appeared first on FinanceBrokerage.


