


Oil and natural gas: Oil is moving above the $76.00 level
- This week, the price of oil remains at a high level, moving in the $73.50-$77.50 range.
- The price of natural gas yesterday formed a new July high at the $2.73 level.
Oil chart analysis
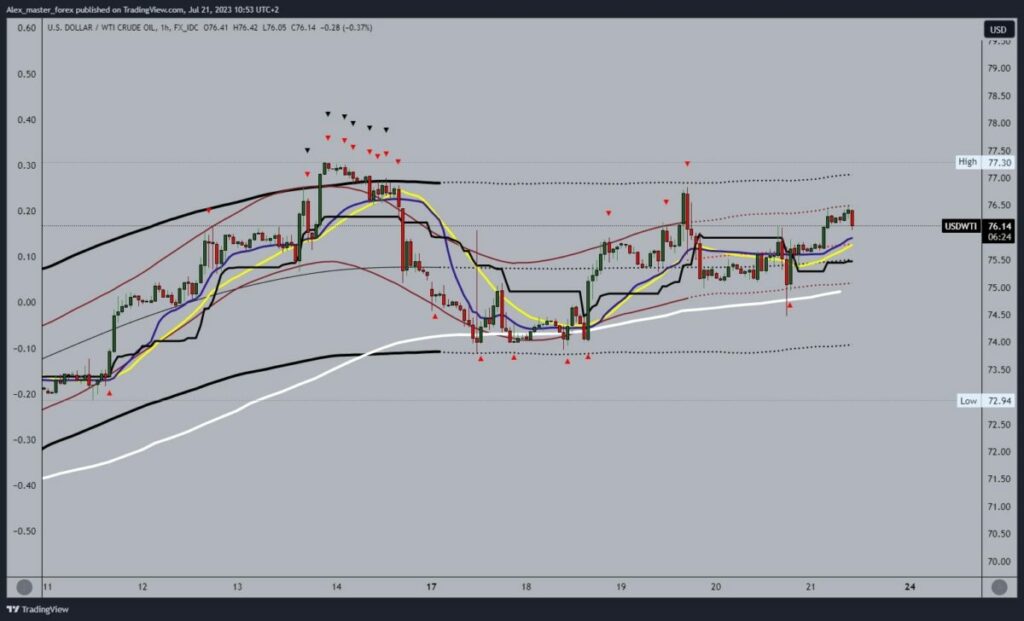
This week, the price of oil remains at a high level, moving in the $73.50-$77.50 range. At the beginning of the week, the price found support at $73.50 and has been in a bullish trend since then. Today’s price high is $76.50, and for now, we have resistance at that level as we see a pullback to $76.00 looking for support. That does not rule out a further pullback to the $75.50 and $75.00 levels. Additional support at $75.00 is at the EMA50 moving average.
We need a positive consolidation and a new move above the $76.50 level for a bullish option. Then, it is necessary to maintain it up there in order to generate a new bullish impulse and start further growth. Potential higher targets are $77.00 and $77.50 levels.
Natural gas chart analysis
The price of natural gas yesterday formed a new July high at the $2.73 level. After that, we see a pullback to consolidation during the Asian trading session at the $2.69 level. In the previous hour, the price of natural gas made a strong bullish impulse and moved us to the $2.72 level. It is possible that we will soon see a test of the previous high and a break above it, as well as the formation of a new one. Potential higher targets are $2.74 and $2.75 levels.
We need negative consolidation and price pullback below the $2.69 level for a bearish option. After that, the price would turn down and go into a pullback. Potential lower targets are $2.68 and $2.66 levels. The EMA50 moving average remains low at the $2.60 level.

The post Oil and natural gas: Oil is moving above the $76.00 level appeared first on FinanceBrokerage.


